Introduction
The stress-strain diagram is generally accepted as the plotted results of a tensile test completed
under carefully controlled conditions on a speciman of a metal. The stress-strain diagram important for design
engineers in that it establishes the physical properties of the material under test including the yield strength, the ultimate
strength, the elongation at fracture, the elastic limit etc.
The test is carried out on a bar of uniform cross section, in a testing machine which indicates the tensile
load being applied. The elongation of a calibrated length of the test piece (called the gauge length) is recorded by
and extensometer or strain gauge.
The load is gradually increased until the specimen breaks.
The measured load results and the extension results are then converted to
stress values (Load/specimen area) and strain values (extension / gauge length ) and the results are plotted
on a graph. The stress levels resulting from this test are nominal or practical engineering values.
The tensile test does not provide any information as to the strength
of a material under highly cyclic loading, and does not identify the resistance of the material to shock loading.
Other test procedures are required to test these factors.
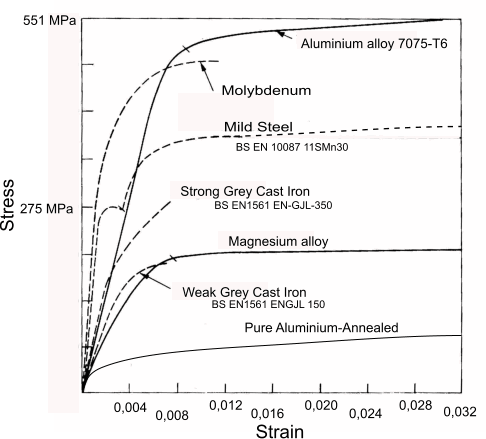
Different materials clearly result in different graphs. The notes that follow relate to these
different graphs and the important data which is extracted from these graphs.

Stress Strain Graph showing the curves of some different engineering metals
Notes
This diagram is simply showing some curves for some materials, they are not
representative of all the materials of a particular type . The grey cast irons are shown as representing
brittle materials however: ferritic cast irons can have a elongation at failure of 22% (2" gauge length).
The mild steel curve is representative of a metal with a pronounced yield point. There are many alloy steels which are
brittle and have tensile strengths far above the range of the graph.
It is also important to identify that the actual physical characteristics of a metal can vary significantly
due to its thickness i.e. the proof stress and ultimate stresses quoted in the standards are generally related to the
thickness the thicker the section - the lower the average strengths. The strength /elongation can also be
affected by the direction of loading relative to the grain which reflects the direction of rolling/casting.
The stress strain graphs resulting tensile testing are only truly representative of the metal if care is used
in the selection of the test specimen and it the evaluation of the curve.
Symbols / Units
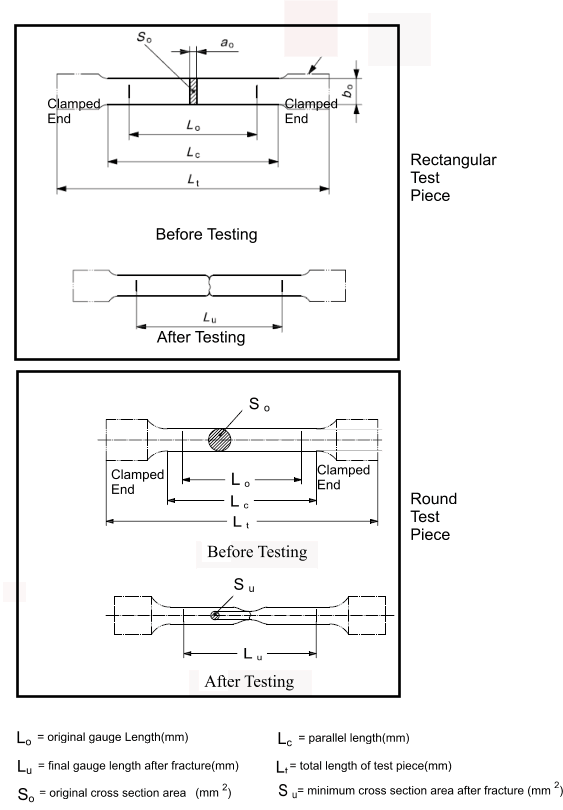
A = % elongation at fracture BS ident.
L = length (m)
Lo = original gauge length (mm) ) BS ident.
Lu = final gauge length (mm) ) BS ident.
Lc = length of parallel portion of test piece (mm) ) BS ident.
Lt = overall length of test piece (mm) ) BS ident.
F = Force (N)
σ = Tensile stress (N/m2)
E = Young's moudulus of elasticity (MPa) BS ident.
ε = strain in direction of stress
δ = deflection(m)
Fm = maximum force (N) BS ident.
|
mE = Slope of the elastic part of the stress-percentage (MPa) BS ident
ReH = upper yield strength (MPa) BS ident.
ReL = lower yield strength (MPa) BS ident.
Rm = tensile strength (MPa) BS ident.
Rp = proof strength, plastic extension (MPa) BS ident.
Rr = Specified permanent set strength (MPa) BS ident.
Rt = MPa proof strength,total extension (MPa) BS ident.
So = original cross section area of test piece (mm2) BS ident.
Su = minimum cross section area after fracture (mm2) BS ident.
S = Current minimumum cross section area of test piece (mm2) BS ident.
|
Reference Standard
BS EN ISO 6892 - 1:2009 Metallic Materials Tensile Testing. Part 1 Method of Test at Room Temperatures
Engineering Stress Strain Diagram for Mild Steel
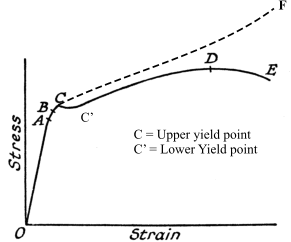
The diagram below shows the stress strain diagram for a typical ductile steel.

The important points on this graph are identified as follows.
The stress strain relationship is a straight line between 0 and A . This region is called the Elastic
region. Within this region if the load is removed the specimen would return to its original length. The slope
of the curve in this region (stress/strain) is identified as Youngs Modulus (E). The design of machines is
based on component materials operating within this region. The point A is called the Elastic/Proportional limit.
The region from A to the breaking point E /F the region is called the plastic region.
Between A and B some plastic yielding takes place . Removal of the stress results in significant recovery of the
initial length.
At point C there is a definite extension with no increase in load. This is called the yield point
and is primarily exhibited in ductile materials such as mild steel. The stress reduces at C and there are two yield stress values
used to identify the yield value i.e. the upper yield point and the lower yield point. For materials exhibiting
no clear yield point an value proof stress is identified as the point of onset of yielding e.g. a 0,2% proof stres is
the point at with the material has yielded (non-recoverable extension) by 0,2%.
Between C and D the specimen continues to extend as the load increases the extension being primarily not recoverable
the material is deforming plastically. Removing the load will result in recovery of only the strain between
0 and A. The material is actually becoming a little stronger in this region as a result of cold working
At point D the specimen will exhibit a significant reduction is section diameter within the calibration length. The specimen
will start to neck. The reference ultimate /maximum tensile stress of a material is calculated by dividing
the load by the original section area.
In the region from C to D the diameter of the specimen is reducing as the linear strain increases. this is a result of the Poissen effect.
From D to E the cross section will reduce significantly as the specimen approaches failure. The true stress in the region from C to Fracture is shown as the dotted line and, is different to
that recorded on the stress-strain curve. The true stress is shown on the diagram as the curve from C to F.
From D to E the specimen will start to lengthen with no increase in load and the overall strain at point E is important
as it identifies the ductility of the material and is listed in the material standards as the % elongation at rupture.
Note:
It is important to note that the % elongation at failure is not a real value. The result from the test
measures the elongation over "The Gauge Length". In fact most of the real elongation only occurs over a short length
due to localised necking. Thus the elongation effect over a 50mm gauge length may be 20% , Over a 100mm gauge length
the elongation would probable be measured at near 10%"
Stress Strain Diagram brittle Material
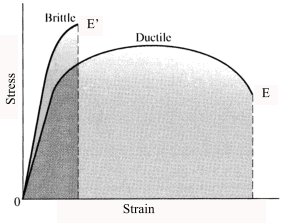
The diagram below shows Stress strain graph for a brittle and a ductile material.
A typical brittle material is Cast Iron. Steels become increasingly brittle as the carbon content increases.
Brittle fractures are generally clean and the ends of the test piece are sqaure and mate together.

True Stress and Strain
It is clear that the tensile testing procedure yields important values for specifying
engineering materials. It is however
important to note that the stress and strain values identified in the test are not true stress and strain values. Thery are
known as Engineeering stress and engineering strain.
Engineering stress = Force / Original Specimen Area = F / So
Engineering strain = extension/ Original Specimen Length = ( Lu - Lo ) / Lo
The true stress and the true strain differs from the real value
continuously as the strain increases.
The true stress = Force / Actual Specimen minimum area Area = F / S
True strain = logarithmic strain = Sum of incremental elongations /current length

Tensile Test Specimen
The diagram below shows test specimen geometry as illustrated in the above identified standard.
The test specimen can be flat, round, rectangular, hexagonal,or tubular. The geometry of the test specimen is selected
based on the material being tested i.e a round bar would require a round test piece, a sheet would require a flat test piece.

Typical proportions for a round test piece are
d = 5mm, Lo = 25mm, Lc = 28mm
d = 10mm, Lo = 50mm, Lc = 55mm
d = 14mm, Lo = 70mm, Lc = 77mm
d = 20mm, Lo = 100mm, Lc = 10mm
|