Control Index
Frequency (Harmonic)Response Methods
|
Introduction The frequency response is a representation of the system's open loop response to
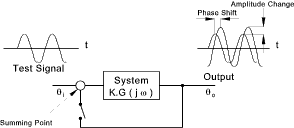
sinusoidal inputs at varying frequencies. The output of a linear system
to a sinusoidal input is a sinusoid of the same frequency but with a different
amplitude and phase. The frequency response is defined as the amplitude
and phase differences between the input and output sinusoids. The
open-loop frequency response of a system can be used to predict the behaviour of the
closed-loop system .
To plot the frequency response, it is necessary to create a vector of frequencies (varying between
zero (DC) and infinity) and compute the value of the system transfer function at
those frequencies. If G(s) is the open loop transfer function of a system
and ω is the frequency vector, we then plot G(j.ω) vs.
ω. Since G(j.ω) is a complex number, we can
plot both its magnitude and phase (the Bode plot) or its position in the complex
plane (the Nyquist plot).
Harmonic response methods can be completed using algebraic manipulation and can also
be completed by testing actual systems..
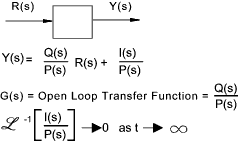
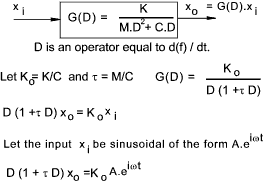
Frequency Response Theory Using Laplace Transfer Functions Consider a basic open loop transfer function..
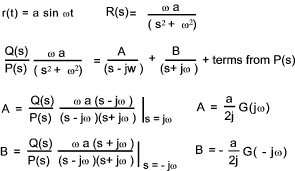
The system response to a sinusoidal input is considered by providing an input signal = a. sin(ω t)
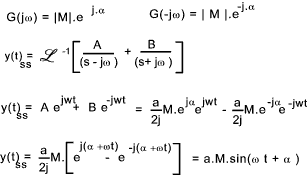
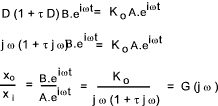
G( jω) and G(-jω) are complex values of the Open loop transfer function with s replaced by jω.
M the Magnification factor (Magnitude ratio) =y(t) / r(t). This is a function of the frequency ω.
The response includes a transient response (complimentary function) and a steady state (forced) response(particular integral). In frequency response analysis only the steady state response needs to be considered. The system is linear and the output will thus be sinusoidal at a frequency ω.
If G (j ω ) = -1 ( unity gain at a phase shift of 180 ) it can be proved that the closed loop system with unity feedback will be unstable.
It can be proved that the value of ω for a value of |G(jω)| = 1 =
Phase difference between input and output =
The Nyquist plot is simply a plot of G(jω) on an argand diagram for a range of frequencies from Frequency Response Systems Characteristics
In closed loop system , if at some frequency the signal undergoes no change in amplitude
but is shifted in phase by 180 deg. ( π ) the system will be unstable.
The feedback signal arriving at the summing point will reinforce the input signal and
the progressive cumulative input will result in a theoretically infinite output. The feedback
signal will be effectively a 100% positive feedback.. |
Sites & Links For Control Information
|
|
..Page is being constructed..
Control Index
