Polar graphs
There are a number of polar graph options for studying control systems including the nyquist,
inverse polar plot and the nichols plot. The nyquist open loop polar plot
indicates the degree of stability, and the adjustments required and provides stability information
for systems containing time delays. Polar plots are not used exclusively because,without
powerful computing facilities, they can be difficult to generate at a detailed level and they do
not directly yield frequency values.
The Nyquist plot is obtained by simply plotting a locus of imaginary(G(j ω))
versus Real(G(j ω)) at the full range of frequencies
from ( - ¥ to + ¥ )
It is very easy to produce nyquist plots by hand or by using proprietary
software packages such as Matlab. Links below show how bode and nyquist plots can be
produced using Excel and using Mathcad. The plots below have been produced
in minutes using Mathcad..
The nyquist plot fundamentals are shown below....
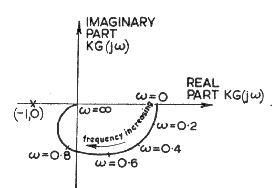
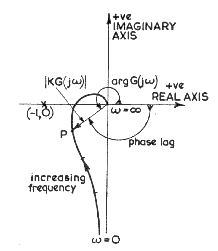
Velocity Feedback control
Basic Rules for constructing Nyquist plots
In control systems a transfer function to be assessed is often of the form

This transfer function is modified for frequency response analysis by replacing the s with jω

Assuming the function is proper and n > m..he Nyquist plot will have the following
characteristics. Crude plots to be may be produced relatively easily using these characteristics.
- Asymptotic behavior.. For n - m > 1, the Nyquist plot approaches the origin
at an asymptotic angle of -(n-m) p/2...
- Assuming G(s) = K(s)/s k. For k poles at zero, the
Nyquist plot comes in from infinity at an angle of -(n-m) p/2
- In a system with no OL zeros, the plot of G(jω)
will decrease monotonically as ω rises above the level
of the largest imaginary part of the poles; This will also be true for large
enough ω even in the presence of zeros.(Ref plot 1 below).
- The plot will cross the imaginary axis when Real G(jω) =0 and will cross the real axis
when Imaginary G(jω) = 0, ( for crossing of the negative real axis use Arg- G(jω)= p )
|
Relative stability assessments Using the Nyquist Plot
As identified in the page on frequency response Frequency response The nyquist
plots are based on using open loop performance to test for closed loop stability. The system will be unstable
if the locus has unity value at a phase crossover of 180 o ( p ).
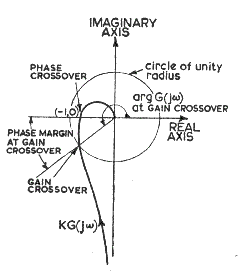
Two relative stability indicators "Gain Margin" and "Phase Margin" may be determined
from the suitable Nyquist Plots. The degree of gain margin is indicated
as the amount the gain is less than unity when the plot crosses the 180 o axis (Phase crossover).
The phase margin is the angle the phase is less than 180 o when the gain is unity. The values
are generally identified by use of Bode plots
The phase margin is clearly illustrated below
Nyquist Stability Criterion.
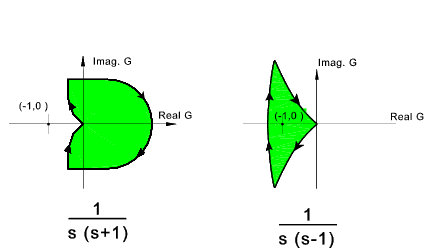
In the nyquist plots below the area covered to the right of the locus(shaded)
is the Right Hand Plane (RHP)
A closed loop control system is absolutely stable if the roots of the characteristic equation
have negative real parts. This means the poles of the closed loop transfer function,
or the zeros of the denominatior ( 1 + GH(s)) of the closed loop tranfer function, must lie in the (LHP).
The nyquist stability criterion establishes the number of zeros of (1 + GH(s) in the RHP directly from the
Nyquist stability plot of GH(s) as indicated below.
The closed loop control system whose open loop transfer function is GH(s) is stable only if..
N = -Po ≤ 0
where
1) P o = the number of G(s) poles in the RHP ³ 0
2) N = total number of CW encirclements of the (-1,0) in the G(s) plane.
If N > 0 the number of zeros (Z o) in the RHP is determined
by Z o = N + P o
If N ≤ 0 the (-1,0) point is not enclosed by the nyquist plot.
If N ≤ and P 0 then the system is absolutely stable only if N = 0.
That is if and only if the (-1,0) point does not lie in the shaded region..
Considering the LH plot above of 1/s(s+1). The (-1,0) point is not in the RHP therefore N<= 0.
The poles are at s =0, and s=-1, both outside of the RHP and therefore P o = 0.
Thus N = -P o = 0 and the system is therefore stable.
Considering the RH plot above of 1/s(s-1). The (-1,0) point is enclosed
in the RHP and therefore N > 0 (N= 1). The poles of GH are at s= 0 and s = +1 .
S= +1 is in the RHP and therefore P o = 1.
N ¹ - P o Indicating that this system is unstable..
There are Z o = N + P o zeros of 1+GH in the RHP.
Nyquist Plots
A number of typical nyquist plots are shown below to illustrate the various shapes.
Plot 1..... 1 /(s + 2)
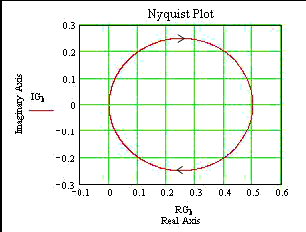
1 /(s + 2)
Note that G(i0) = 0.5 and as ω increases to ¥ the plot approaches zero along the negative locus.
G(jω) moves from 0 to 0.5 as
ω - ¥ to 0
G(j ¥) = 0
The asymptotic angle approaching 0 is = -90 o and
Plot 2.....1 /(s 2 + 2s + 2)
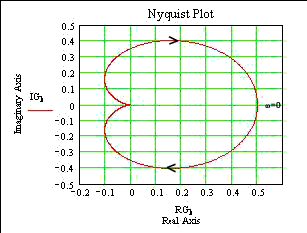
1 /(s 2 + 2s + 2)
The zero-frequency behaviour is:G(j0) =0.5
G(j ¥) = 0
The asymptotic angle is = -180 o
Plot 3.....s(s+1) /(s 3 + 5.s 2 +3.s + 4 )
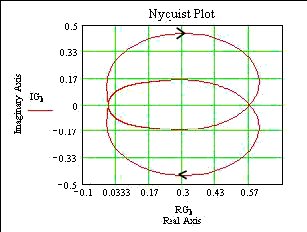
s(s+1) /(s 3 + 5.s 2 +3.s +4 )
Plot 4.....(s+1) /[(s+2)(s+3)]
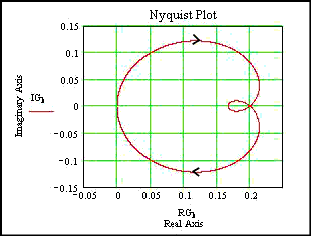
((s+1) /[(s+2)(s+3)]
Plot 5.....1 /s(s-1).. an unstable regime
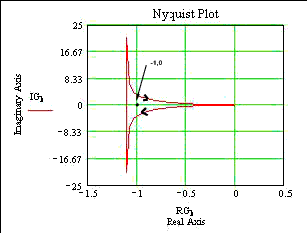
(1 /s (s-1)
|


