Introduction
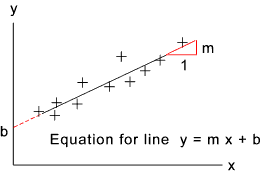
In an experiment it is normal to obtain a number of data points (x,y) on a graph.
It is generally required to find a line that best fits these points and thus resulting
in a nice rule that can be reasonably applied to the experimental results. This
is most often done by simply drawing a line on the graph paper by eye using judgement.
To achieve this with a little more precision a statistical process called linear regression is used.
The method described on this page is to obtain a line which is a best fit if it minimises
the squares of the deviation of the data points from the line.
Symbols
x ( xi ) = abscissa value
y ( yi ) = ordinate value
n = number of data points
ei = deviation of yi for best fit line
m = slope line of line
|
m = slope line of best fit line
b = y intercept value of line
b = y intercept value of best fitline
sx = standard deviation of sample points x values
sy = standard deviation of sample points y values
r = correlation coefficient
|
Linear regression
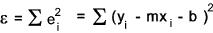
Consider a set of n data point (xi ,yi) ). In general
the best fit line will not intersect a data point and the following relationship applies.
y i = m xi + b + e i
Where e i = y i - y.
This makes a reasonable assumption that x = x i i.e there is no
error on the x value.
The sum of the deviations is
To obtain the best fit line involves minimising ε requiring 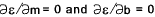
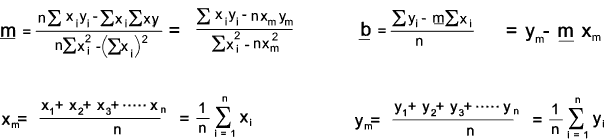
This results in two simultaneous equations for the best fit line with a slope m and y intercept b. Solving these equations
result in
Correlation Factor
On calculating a best fit line it is useful to determine if the line is a corrleation with the points
. If the points are scattered all over the xy plane then the correlelation is poor.
If the points are all located along the best fit line then the correlation is good. The equation
for the correlation r =
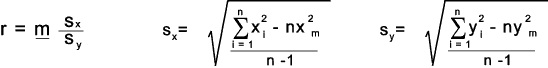
sx and sy are the standard deviations of the x and y sample points.
If r = 0 there is no correlation. If r is 1 or -1 then there is perfect correlation. The positive
or negative r indicates that the regression line has a positive or negative slope respectively.
|