Introduction
When sample sizes are small, and the standard deviation of the population is unknown
it is normal to use the distribution of the t statistic (also known as the t score),
whose values are given by:

where xm is the sample mean, � is the population mean, s is the standard deviation
of the sample, and n is the sample size. The distribution of the t statistic is
called the t distribution or Student's t distribution.
The t-distribution is generally used if any of the following conditions apply;
If the sample is symmetrical, uni-model and with a sample size less than say 15
If the sample is moderately skewed and the sample size is 15 - 40
If the sample size is over 40
It is not recommended that this distribution is used if there are any sample
values which are obviously way out compared to the other values.
The probability density function of t is given by
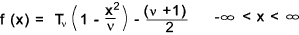
Tν is a constant depending on ν . Thisis
an integer parameter identified as the number of degrees of freedom of the distribution.
Symbols
α = Significance (1% 5% etc)
γ = Confidence ( 99% etc)
n = sample number
f(x) = probability function. (values between 0 and 1)
F(x) = probability distribution function.
ν = number of degrees of freedoms
Xm = Sample mean
var = sample variance
|
Φ (x) = Probability distribution function.(Standardised probability )
μ = population /random variable mean
σ 2 = population /random variable variance
σ = population /random variable standard deviation
xm = arithmetic mean of sample
sx 2 = variance of sample
sx = Standard deviation of sample
|
Degrees of Freedom
The number of degrees of freedom as applied in the t-distribution =
ν = n - r
r = the number of population parameters which have to be estimated.
In the case of evaluating t
xm and sx can be calculated from the data and μ has to be estimated therefore r = 1
ν = n - 1
Properties
The t distribution has the following properties:
The mean of the distribution is equal to 0 .
The variance is equal to ν / (ν - 2 ), where ν is the degrees of
freedom (see above) and ν > 2.
The variance is always greater than 1, although it is close to 1 when there are many degrees of freedom.
With infinite degrees of freedom, the t distribution is the same as the standard normal distribution.
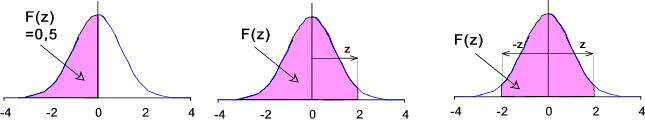
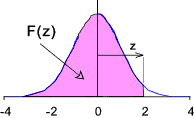
One or Tail tailed tests
The table below includes the value or F(z) and is a one tailed distribution, that it includes the area under
the curve from -  to z. to z.
The values in this table are applicable to one-tailed tests. A one tailed test is used to
test if one mean is higher than another or if it is equal to another. The following hypothesis are being tested
H0: μ = μo
or
H1: μ < μo
H1: μ > μo
If the calculated value is greater than z as shown as the unshaded region then any of the above
hypothesis can be accepted.
The hypothesis that μ ≠ μo can not be tested with a
one tailed test and the two tailed test should be used.
HO:μ = μ
H1:μ ≠ μ
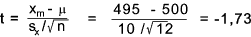
To use the table below for a two tailed test with a confidence level α = say then use table values for
a confidence level of 0,5 + α /2. and apply the resulting z value as a ± value as the curve is symmetrical.
Example:if the required confidence level is then use the table with confidence levels of (0,5 + 0,90/2) = 0,95
Examples
Example 1:
A sample of twelve tubs of margarine gave a mean mass of 495 gm and a standard deviation
10 gm . The mass stated on the tub is 500 gm .
What is the confidence that the mean mass of margarine tubs is the stated value.
Best estimate for the mean μ mass = 500
Null hypothesis Ho: μ =500
Alternative hypothesis H1:μ ≠ 500
sx = 5 2
n = 12 and ν = n - 1 = 11
The table below F(z)is used to determine the +/- confidence limits.
The area under the t curve from - to + c = 0,5 + (0,95/2)= 0,975 From the table +c= 2,201
The area under the t curve from - to - c = 0,5 - 0,95/2 = 0,025. From the table -c = -2,201 ****
Therefore if the mean value is 500 gm there is a confidence that the t score will be within the
range -2,201 to 2,201 with a 5% significance that the mean value is not 500 gm
The t-score is calculated as
The resulting t-score is -1,73 and therefore the masses of the samples are within the confidence limits. The null hypothesis is not rejected.
**** 0,975 = F(2,201) then 1 - 0,25 = 0,975 = F(-2,201).
Example 2:
Consider 104 tensile tests on twine resulting in the following table of breaking loads (N).
The population is assumed to be normal.
Determine the 99% confidence interval for the corresponding population mean.
| Breaking load ( Newtons) |
| 201 |
234 |
242 |
250 |
256 |
261 |
267 |
271 |
277 |
282 |
292 |
300 |
310 |
| 203 |
234 |
243 |
250 |
256 |
262 |
267 |
271 |
277 |
283 |
293 |
302 |
312 |
| 221 |
237 |
246 |
252 |
257 |
264 |
268 |
272 |
278 |
284 |
293 |
302 |
315 |
| 224 |
238 |
246 |
252 |
258 |
264 |
268 |
272 |
278 |
286 |
294 |
304 |
316 |
| 224 |
239 |
247 |
252 |
259 |
265 |
268 |
273 |
279 |
287 |
296 |
304 |
321 |
| 229 |
239 |
247 |
253 |
259 |
266 |
269 |
273 |
279 |
289 |
297 |
306 |
326 |
| 231 |
241 |
249 |
254 |
260 |
266 |
270 |
276 |
281 |
291 |
298 |
307 |
341 |
| 231 |
241 |
249 |
256 |
261 |
266 |
271 |
276 |
282 |
291 |
299 |
309 |
342 |
By simple arithmetic the sample mean xm = 269,90
By simple arithmetic the variance sx2 = 763.04.
Therefore Standard Deviation sx = 27,62
n = 104 and ν = n - 1 = 103:
Using the table below with F(z)= 0,5 + 0,99/2 = 0,995 therefore using ν = 100
c = 2,626
As the curve is symmetrical t = +/- 2,626

The 99% confidence limits for the sample mean is 262,72 and 277,01.
Example 3:
Eight hens were fed with different two different type grain
for a period of one month.
The eggs laid be each hen in the two monthly periods were as follows
Test the hypothesis that grain type A yields better results than grain type B
The null hypothesis is that the hens lays the same number of eggs on both types of grain .. Ho:μA = μB
The alternative hypothesis is that hens fed on grain A lay more eggs than the when fed with grain B.. Ho:μA > μB
| Chicken No | 1 | 2 | 3 | 4 | 5 | 6 | 7 | v8 |
| Grain type A | 18 | 17 | 19 | 14 | 15 | 17 | 11 | 14 |
| Grain type B | 16 | 16 | 15 | 17 | 16 | 15 | 12 | 15 |
The mean difference for each hen is (d m)
dm = (2 + 1 + 4 + -3 + -1 + 2 + -1 + -1) /8 = 0,375
s d 2 =
[(2 - 0,375) 2 + (1 - 0,375) 2 + (4 - 0,375) 2 + (-3 - 0,375) 2 +
(-1 - 0,375) 2 + (2 - 0,375) 2 + (-1 - 0,375) 2 + (-1 - 0,375) 2 ]/(8-1) = 5,124
dx = 2,264
The degrees of freedom ν = n - 1 = 7
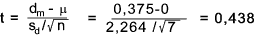
The significance value α for the null hypothesis is 5%.
The associated confidence of the null hypothesis = 1- α = (0,95).
For ν = 7 and f(z) = 0,95 the difference is 0 is 1,895 from the table below.
The hypothesis that the mean is greater than 0 is not rejected if t is greater than 1,895. As t is
0,438 there is no difference in the use of the two feed types.
Students t- Distribution ..Table of z for given values of F(z)
Note: F(-z) = 1- F(z)
| Deg Of Freedom |
F(z) |
| 0,5 |
0,6 |
0,7 |
0,8 |
0,9 |
0,95 |
0,975 |
0,99 |
0,995 |
| 1 |
0 |
0,3249 |
0,7265 |
1,3764 |
3,0777 |
6,3137 |
12,7062 |
31,821 |
63,6559 |
| 2 |
0 |
0,2887 |
0,6172 |
1,0607 |
1,8856 |
2,92 |
4,3027 |
6,9645 |
9,925 |
| 3 |
0 |
0,2767 |
0,5844 |
0,9785 |
1,6377 |
2,3534 |
3,1824 |
4,5407 |
5,8408 |
| 4 |
0 |
0,2707 |
0,5686 |
0,941 |
1,5332 |
2,1318 |
2,7765 |
3,7469 |
4,6041 |
| 5 |
0 |
0,2672 |
0,5594 |
0,9195 |
1,4759 |
2,015 |
2,5706 |
3,3649 |
4,0321 |
| 6 |
0 |
0,2648 |
0,5534 |
0,9057 |
1,4398 |
1,9432 |
2,4469 |
3,1427 |
3,7074 |
| 7 |
0 |
0,2632 |
0,5491 |
0,896 |
1,4149 |
1,8946 |
2,3646 |
2,9979 |
3,4995 |
| 8 |
0 |
0,2619 |
0,5459 |
0,8889 |
1,3968 |
1,8595 |
2,306 |
2,8965 |
3,3554 |
| 9 |
0 |
0,261 |
0,5435 |
0,8834 |
1,383 |
1,8331 |
2,2622 |
2,8214 |
3,2498 |
| 10 |
0 |
0,2602 |
0,5415 |
0,8791 |
1,3722 |
1,8125 |
2,2281 |
2,7638 |
3,1693 |
| 11 |
0 |
0,2596 |
0,5399 |
0,8755 |
1,3634 |
1,7959 |
2,201 |
2,7181 |
3,1058 |
| 12 |
0 |
0,259 |
0,5386 |
0,8726 |
1,3562 |
1,7823 |
2,1788 |
2,681 |
3,0545 |
| 13 |
0 |
0,2586 |
0,5375 |
0,8702 |
1,3502 |
1,7709 |
2,1604 |
2,6503 |
3,0123 |
| 14 |
0 |
0,2582 |
0,5366 |
0,8681 |
1,345 |
1,7613 |
2,1448 |
2,6245 |
2,9768 |
| 15 |
0 |
0,2579 |
0,5357 |
0,8662 |
1,3406 |
1,7531 |
2,1315 |
2,6025 |
2,9467 |
| 16 |
0 |
0,2576 |
0,535 |
0,8647 |
1,3368 |
1,7459 |
2,1199 |
2,5835 |
2,9208 |
| 17 |
0 |
0,2573 |
0,5344 |
0,8633 |
1,3334 |
1,7396 |
2,1098 |
2,5669 |
2,8982 |
| 18 |
0 |
0,2571 |
0,5338 |
0,862 |
1,3304 |
1,7341 |
2,1009 |
2,5524 |
2,8784 |
| 19 |
0 |
0,2569 |
0,5333 |
0,861 |
1,3277 |
1,7291 |
2,093 |
2,5395 |
2,8609 |
| 20 |
0 |
0,2567 |
0,5329 |
0,86 |
1,3253 |
1,7247 |
2,086 |
2,528 |
2,8453 |
| 21 |
0 |
0,2566 |
0,5325 |
0,8591 |
1,3232 |
1,7207 |
2,0796 |
2,5176 |
2,8314 |
| 22 |
0 |
0,2564 |
0,5321 |
0,8583 |
1,3212 |
1,7171 |
2,0739 |
2,5083 |
2,8188 |
| 23 |
0 |
0,2563 |
0,5317 |
0,8575 |
1,3195 |
1,7139 |
2,0687 |
2,4999 |
2,8073 |
| 24 |
0 |
0,2562 |
0,5314 |
0,8569 |
1,3178 |
1,7109 |
2,0639 |
2,4922 |
2,797 |
| 25 |
0 |
0,2561 |
0,5312 |
0,8562 |
1,3163 |
1,7081 |
2,0595 |
2,4851 |
2,7874 |
| 26 |
0 |
0,256 |
0,5309 |
0,8557 |
1,315 |
1,7056 |
2,0555 |
2,4786 |
2,7787 |
| 27 |
0 |
0,2559 |
0,5306 |
0,8551 |
1,3137 |
1,7033 |
2,0518 |
2,4727 |
2,7707 |
| 28 |
0 |
0,2558 |
0,5304 |
0,8546 |
1,3125 |
1,7011 |
2,0484 |
2,4671 |
2,7633 |
| 29 |
0 |
0,2557 |
0,5302 |
0,8542 |
1,3114 |
1,6991 |
2,0452 |
2,462 |
2,7564 |
| 30 |
0 |
0,2556 |
0,53 |
0,8538 |
1,3104 |
1,6973 |
2,0423 |
2,4573 |
2,75 |
| 40 |
0 |
0,255 |
0,5286 |
0,8507 |
1,3031 |
1,6839 |
2,0211 |
2,4233 |
2,7045 |
| 50 |
0 |
0,2547 |
0,5278 |
0,8489 |
1,2987 |
1,6759 |
2,0086 |
2,4033 |
2,6778 |
| 60 |
0 |
0,2545 |
0,5272 |
0,8477 |
1,2958 |
1,6706 |
2,0003 |
2,3901 |
2,6603 |
| 100 |
0 |
0,254 |
0,5261 |
0,8452 |
1,2901 |
1,6602 |
1,984 |
2,3642 |
2,6259 |
| 200 |
0 |
0,2537 |
0,5252 |
0,8434 |
1,2858 |
1,6525 |
1,9719 |
2,3451 |
2,6006 |
| 5000 |
0 |
0,2534 |
0,5244 |
0,8417 |
1,2817 |
1,6452 |
1,9604 |
2,3271 |
2,5768 |
|