Statistics Index
Discrete Probability distributions
Introduction.....
Symbols.....
General Notes.....
Uniform Distribution.....
Binomial Distribution.....
Poisson Distribution.....
Hypergeometric Distribution.....
|
Introduction A discrete random variable can only take on the value of a distinct number i.e. 0,1,2,3 etc. Typical descrete numbers
include number of children in a family, attendance at a theatre, the number of patients in a hospital ward,
the number of defective bulbs in a box of ten. Symbols In the notes below the probability distributions relate to probability of successes. In practice they could equally relate to failures, or outcomes with desired values ( dice throw = 6)
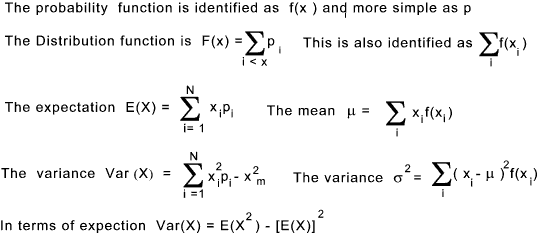
*** F(x) ... In n trials number of successes ≤ x General Notes
The expectation E(X) is synonymous with the mean and μ is often used
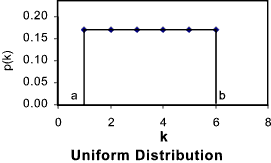
to represent the mean of a random variable. Uniform Distribution
Note: ..
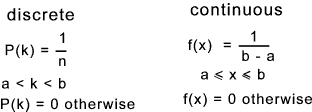
The probability density function
The probability distribution function
The distribution mean
The Variance
Binomial Distribution Table of binomial probability distributions This distribution relates to the number of times a success occurs
in n independent trials. The conditions for a binomial probability distribution are. The trials must be independent The probability density function is
The probability distribution function is. Identities the probability of up to and including k events occur
The expected mean μ
The variance σ 2 =
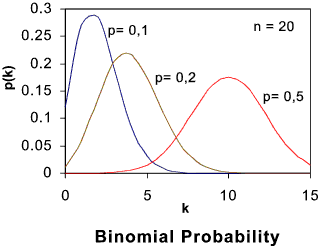
The graph below shown some typical binomial distribution probability density forms .
Poisson Distribution Table of Poisson Probability distributions The Poisson distribution is simply a limiting case of the binomial distribution with p -> 0, and n - > infinity such that the mean is m = np which approaches a finite value. Typically, a Poisson random variable is a count of the number of "successful events-!!" that occur in a certain time interval or spatial area. For example, the number of cars passing a fixed point in fixed time period, the number of defects per unit area of material, or the defects in a thread per unit length. The Poisson distribution is sometimes used to approximate the
Binomial distribution with parameters n and p. When the number
of observations n is large, and the success probability p is small, the binomial
distribution approaches the Poisson distribution with the parameter given
by m = np. This is useful since the computations involved in
calculating binomial probabilities are significantly reduced. The basis measurement e.g length of the observation period, area,
length , needs to be fixed in advance; The probability density function is
The probability distribution function is
The expected mean μ The variance σ 2 =
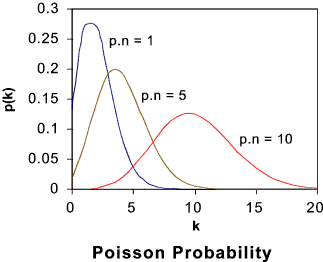
The graph below shown some typical Poisson distribution probability density forms .
Hypergeometric Distribution Where the binomial probability function involves sampling with replacement i.e. each trial is in dependent the hypergeometric distribution involves sampling without replacement. The trials are therefore not independent. The probability density function is
The probability distribution function is
The expected mean μ
The variance σ 2 =
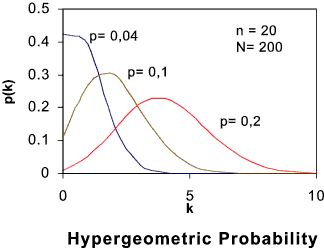
The graph below shown some typical hypergeometric distribution probability density forms .
|
Useful Related Links
|
|
