Introduction
A confidence interval gives an estimated range of values which
is likely to include an unknown population parameter eg the mean, the estimated range
being calculated from a collected sample of data. The width of the confidence
interval gives us some idea about how uncertain we are about the unknown parameter
. A very wide interval may indicate that more data should
be collected before anything very definite can be said about the parameter.
The only way you can really get a statistical parameter of a population with 100% confidence
is
to test the whole population. Generally the population is large and testing the
whole population is costly and impracticable. However it is possible to
use a sample and to calculate a range within which the population parameter value is
likely to fall. Normally this is taken to be " likelyhood," and the
range is called the confidence interval. It is also possible to
produce , 99%, 99.9%, confidence intervals for the unknown parameters.
Symbols
f(x) = probability function. (values between 0 and 1)
F(x) = probability distribution function.
Xm = Sample mean
var = sample variance
Φ (x) = Probability distribution function.(Standardised probability )
|
μ = population /random variable mean
σ 2 = population /random variable variance
σ = population /random variable standard deviation
xm = arithmetic mean of sample
sx 2 = variance of sample
sx = Standard deviation of sample
|
Confidence Interval ref.Normal Probability Distribution
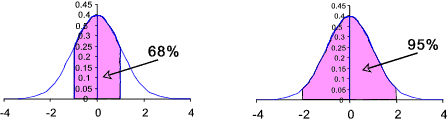
It can be easily proved that for data that is "normally distributed"
about 68.3% of the data will be within 1 standard deviation ( σ )
of the mean μ (i.e., within the range μ ± σ).
In general there is a relationship between the fraction of the included data
and the deviation from the mean in terms of standard deviations
e.g the data fraction is related to μ ± c.σ) as shown in the table
below
| Fraction of Data values | c |
| 50,0% | 0,674 |
| 68,3% | 1,000 |
| 90,0% | 1,645 |
| 95,0% | 1,960 |
| 95,4% | 2,000 |
| 98,0% | 2,326 |
| 99,0% | 2,576 |
| 99,7 | 3,000 |
Examples of data spread:
For a sample of a normal population one would expect about 68% of the
values to be within ± 1.00 of the sample mean xm
For a sample of a normal population one would expect about of the
values to be within ± 1.96 of the sample mean xm.
Example 1:
A random variable is normally distributed with a standard deviation of 5.
A random single sample from this distribution is 12,4 . Find the interval of values such that
there is a 99% confidence that the population mean is with the interval range.
From the table above P(μ -2,58 σ < x < +2,58 σ ) = 0.99
Therefore P(μ -12,9 < x < + 12,9 )= 0.99
This implies P(12,4 -12,9 < μ < 12,4 -12,9 ) =0,99
That is -0,5 < μ < 25,3 = with 99% confidence.
This is simply stating that based on a single sampled value of 12,4 then there
is a 99% confidence that the population mean is within the rang -0,5 to 25,3. This is
a wide range and not very useful. To obtain a more smaller interval a larger
sample, ( greater n ) is required. The distribution of the mean of this
sample will be normally distribution with a variance of σ 2 /n (refer to notes below)
Example 2:
Obtain a confidence interval for the mean of a normal distribution
with a variance σ 2 = 9, i.e a standard deviation σ = 3
using a sample of n = 100 with a mean x m = 5:
For a confidence interval c = 1,96.
The confidence interval for a probability = P( xm - 1,96 .3 / √ 100 > μ ;> xm + 1,96 .3 / √ 100 > )
That is there is a confidence that the mean of the population will be within 4,412 and 5,588
Background Theory
Sample distribution of a population mean
Consider a single random variable X
Now x 1....x n are observed
values of X. The x i values can also be values of random variables X 1, X 2..
Xn. These have the same distributions as
X but are independent because the sample values are independent.
Now it is clear that:
X = X 1 + X 2 +.......+X n
This is a normal distribution with a mean
μ = μ 1 + μ 2+....+μn
and a variance
σ 2 = σ 21 + σ 22+....+σ 2n
Considering a population with a mean μ and
variance
σ 2 .
Now taking a number of samples of size n from
this population. Each sample has a mean x m and a variance s x .
It is useful obtain the distribution of the sample mean.
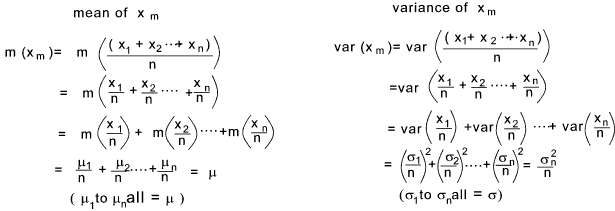
The mean of the sample distribution m (Xm ) = μ
The variance of the sample distribution mean var ( X m) = σ 2 / n
The Standard deviation of the sample distribution mean SD( X m) = σ / √ n
Central Limit Theorem
If X is a random variable with mean μ and variance σ 2
then the distribution of the sample mean approximates to a Normal distribution with mean μ
and variance σ 2 /n as n --> 
This is applicable for all distributions of X when n > 30
This is good for normal distribution for all values of n >0
The Central Limit theorem is the foundation for many statistical
procedures, because the distribution of the population under study does not
have to be Normal : the sample statistic will be tend to a normal distribution anyway.
This is very useful when it comes to inference e.g it permits hypothesis tests
which assume normality even if the basis data seems to be non-normal( assuming reasonably large sample sizes.
This is because the tests use the sample mean , which according to the Central Limit Theorem
will be approximately normally distributed. Hypothesis Tests
|