Statistics Index
Statistics Samples and variables
Introduction...
Symbols...
Samples and Populations...
Variables...
Sample median...
Sample Mean, variance and standard deviation...
Distribution Mean, variance and standard deviation...
Sample relative frequency...
|
Introduction In conducting experiments it is usual to obtain a sequence of results, observation, or values.
These are generally numbers. The listing of these values is general identified as a sample
In obtaining information about a large (infinite)quantity of data (population) obtaining a relatively small
sample of that population allows more convenient analysis of the whole population.
In order to obtain useful results from the sample analysis is required using basic statistical methods. The most important
results of this analysis is the average value and the spread. Symbols In the notes below the probability distributions relate to probability of successes. In practice they could equally relate to failures, or outcomes with desired values ( dice throw = 6)
Samples and Populations Consider a large quantity of items which have been produced by a manufacturing process. It may be too expensive to inspect all of the items and therefore a sample of the items are inspected . Conclusions can then be drawn with respect to all of the items produced (the population). If the sample is 100 items from the population of 10 000 items and 5 of the sample are defective then it is reasonable to assume that 5% of the population = 5000 items are defective. It is clear that this inference is very approximate and depends on the randomness of the sample selection There are several good reasons that we use samples to study populations; chief among them are feasibility and cost. For instance, in a nationwide political survey of the population of all voters in the United Kingdom, it would be difficult, if not impossible, to poll every voter. It would also be quite expensive. Statistical theory shows that a survey of a 1,000 carefully selected voters suffices to represent the opinions of the millions of people in the population of voters. Random sampling is a way to remove bias in sample selection.
For example, to pick a random sample of 100 people out of a population of a 1,000, you
might put all 1,000 names in a hat, then draw 100 of them. Random sampling
attempts to reduce bias in sample selection, since every member of the population has
an equal chance of being selected. Variables.. There are two types of variables... Descrete and Continuous. Sample Median.. The sample median m is the middle value (in the case of an odd-sized sample), or
average of the two middle values (in the case of an even-sized sample), when the
values in a sample are arranged in ascending order. Sample Mean , Variance & Standard Deviation.. Sample Mean The arithmetic mean of a sample of n elements is defined by the equation
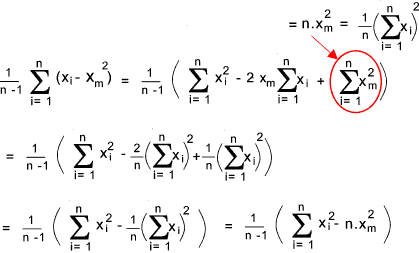
The arithmetic mean is very useful but does not give a clear picture as to the spread of the variable values around the mean. Consider two groups of seven numbers . (n= 7) 1,2 /2,4/ 3,2/ 4,1/ 3,3/ 2,3/ 1,5 xm = 2,571 The arithmetic mean is the same for both samples but the second sample is much more tightly grouped around the average. The deviation of a value is defined as the difference between the value and the arithmetic mean.(x i - x m ) Sample VarianceIt is very useful to know the average of the deviations that is ∑ (x i - x m ) / N.
Note:
The sample standard deviation is defined as the square root of the sample variance.
Distribution Mean , Variance & Standard Deviation.. The above equations apply specifically to samples for which the various
outcomes are known and recorded.
When probability values are being evaluated for whole populations, and infinite number of random events
the mean is identified by the symbol μ and the variance is identified by the symbol
σ 2 Relative frequency In the above notes on the mean and variance and the standard deviation the sample size of n each value of x i
is considered to be a separate value and each value has a probability of 1/n of occurring.
In practice however when sampling there are generally a number (n i ) of occurrences
of x i which are the same (discrete values) or
within the same local range (continuous variables) for each value this frequency
is called the absolute frequency .
Considering the table of sample test results above. The relative frequency function fs (x) is provided for which each value x = xs_i equals the corresponding frequency fs_i Therefore
A sample size n can include k numerical different values. The sum of all relative frequencies = 1 that is
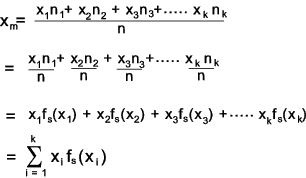
The sample mean is obtained from the relative frequencies as shown below
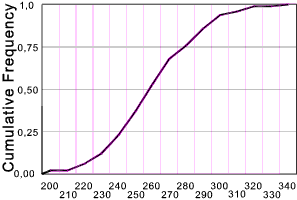
The sample distribution function Fs (x) is provided for which is equal to the sum of all relative frequencies having values ≤ x
The sample variance can be expressed in terms of the relative frequencies as follows
This can be simplified using methods shown above to
For large samples this can be further simplified to
|
Useful Related Links
|
|


